A Complete Guide to Alarms, Auto Scaling, EC2 Monitoring & SNS Notifications
Introduction
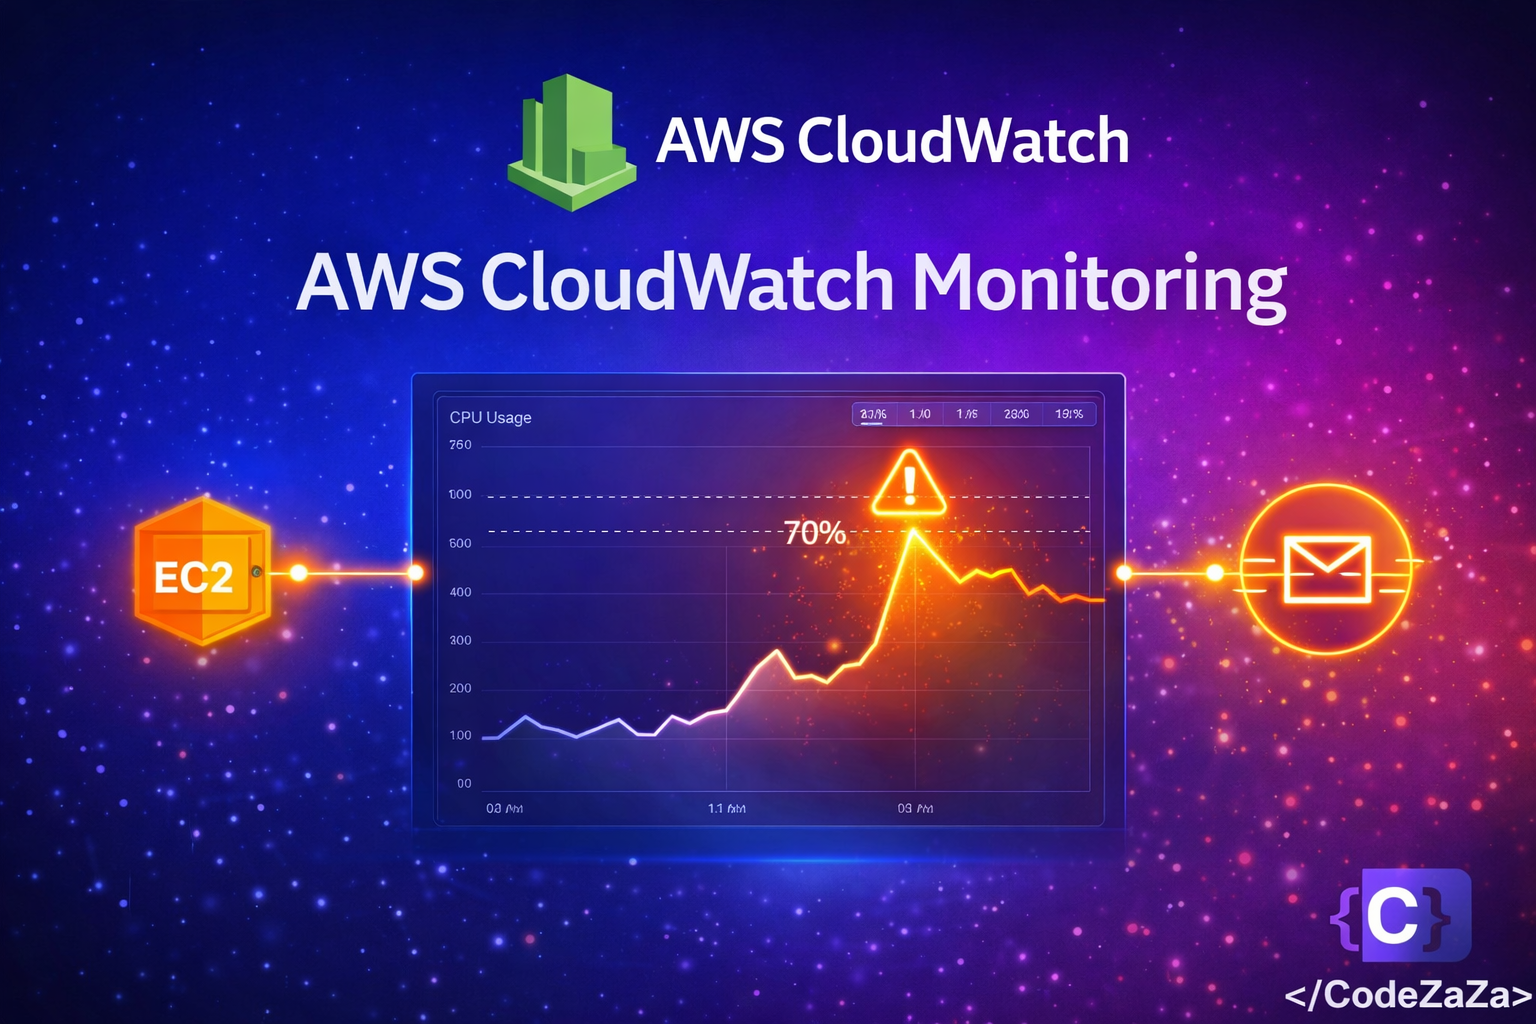
AWS CloudWatch monitoring setup is the foundation of any reliable cloud infrastructure. This guide walks you through EC2 CPU alarms, Auto Scaling, and SNS notifications — with alerts triggered automatically when CPU exceeds 70%.
In modern cloud environments, monitoring is not optional — it is essential. When your application goes down at 3 AM or your server is silently maxing out its CPU, you need to know immediately. This step by step guide covers everything from scratch.
What is AWS CloudWatch Monitoring ?
AWS CloudWatch is a monitoring and observability service built for DevOps engineers, developers, and IT managers. Think of it as the health dashboard for your entire AWS infrastructure. It continuously collects data and lets you react to changes in your AWS resources in real time.
CloudWatch collects three types of data. Metrics are numerical data points over time such as CPU usage, network traffic, and disk I/O. Logs are text records from your applications and AWS services. Events are real-time notifications about changes in your AWS environment.
CloudWatch is deeply integrated with over 70 AWS services out of the box. EC2, RDS, Lambda, and ECS all push metrics to CloudWatch automatically — no setup required.
Read the official AWS CloudWatch documentation at https://docs.aws.amazon.com/cloudwatch
AWS CloudWatch Monitoring Setup Architecture
Before writing a single line, let’s understand what we are building. Here is the complete flow of our monitoring stack:
EC2 Instance emits CPU metrics every 1 to 5 minutes to CloudWatch. CloudWatch then evaluates those metrics against our defined threshold. When the threshold is breached, CloudWatch moves to ALARM state. The ALARM triggers an SNS Topic which sends an email or SMS to your team. At the same time, Auto Scaling receives the alarm and adds new EC2 instances to handle the load. When CPU drops back down, a recovery notification is sent and unnecessary instances are terminated.
This architecture ensures that whenever your EC2 CPU crosses 70%, you get an instant notification AND your infrastructure automatically scales to handle the load.
Step 1 – Enable Detailed Monitoring on EC2
By default, EC2 sends metrics to CloudWatch every 5 minutes. For production systems, you want 1-minute intervals — this is called Detailed Monitoring.
Via AWS Console: Go to EC2 → Instances → Select your instance → Actions → Monitor and Troubleshoot → Enable Detailed Monitoring → Confirm.
Via AWS CLI:
aws ec2 monitor-instances --instance-ids i-0abcd1234efgh5678Detailed Monitoring costs approximately $0.014 per instance per month. For production, this cost is negligible compared to the value of faster alerting.
Step 2 – Create an SNS Topic for Notifications
Before creating alarms, we need somewhere to send the alerts. SNS (Simple Notification Service) acts as the notification hub. Alarms publish messages to SNS, and SNS fans them out to your email, SMS, Slack, or Lambda function.
Create the topic:
aws sns create-topic --name cpu-alert-topicSubscribe your email:
aws sns subscribe \
  --topic-arn arn:aws:sns:us-east-1:123456789012:cpu-alert-topic \
  --protocol email \
  --notification-endpoint your@email.com
After running this command, check your inbox. AWS sends a confirmation email and you must click the Confirm Subscription link before alerts start flowing.
You can add multiple subscribers including different email addresses, phone numbers for SMS, or a Lambda function that posts to Slack. All of them can receive the same alarm simultaneously.
Step 3 – AWS CloudWatch Monitoring Setup for CPU Alerts
This is the core of our setup. We create a CloudWatch Alarm that watches EC2 CPU utilization and fires when it exceeds our 70% threshold.
aws cloudwatch put-metric-alarm \
  --alarm-name "HighCPUUtilization" \
  --alarm-description "Alert when EC2 CPU exceeds 70%" \
  --metric-name CPUUtilization \
  --namespace AWS/EC2 \
  --statistic Average \
  --period 300 \
  --threshold 70 \
  --comparison-operator GreaterThanThreshold \
  --dimensions Name=InstanceId,Value=i-0abcd1234efgh5678 \
  --evaluation-periods 2 \
  --alarm-actions arn:aws:sns:us-east-1:123456789012:cpu-alert-topic \
  --ok-actions arn:aws:sns:us-east-1:123456789012:cpu-alert-topic \
  --treat-missing-data breaching
Breaking down the key parameters:
period 300 means CloudWatch evaluates the average CPU over each 5-minute window.
evaluation-periods 2 means CPU must stay above 70% for two consecutive periods (10 minutes total) before triggering. This prevents false alarms from brief spikes during deployments or cron jobs.
treat-missing-data breaching means if the instance stops reporting metrics, the alarm still fires. This catches crashed or terminated instances automatically.
ok-actions sends a recovery notification when CPU drops back below 70%, so your team knows the issue has resolved.
Step 4 – Set Up Auto Scaling Alarms
CloudWatch Alarms don’t just send notifications — they can also trigger Auto Scaling policies. When CPU is consistently high, new EC2 instances spin up automatically. When CPU drops, instances terminate to save cost.
Scale-Out Alarm — CPU too high, add instances:
aws cloudwatch put-metric-alarm \
  --alarm-name "ASG-ScaleOut-HighCPU" \
  --alarm-description "Scale out when CPU exceeds 70% across ASG" \
  --metric-name CPUUtilization \
  --namespace AWS/EC2 \
  --statistic Average \
  --period 300 \
  --threshold 70 \
  --comparison-operator GreaterThanThreshold \
  --dimensions Name=AutoScalingGroupName,Value=my-app-asg \
  --evaluation-periods 2 \
  --alarm-actions arn:aws:autoscaling:us-east-1:123456789012:scalingPolicy:...:policyName/scale-out-policy
Scale-In Alarm — CPU low enough, remove instances:
aws cloudwatch put-metric-alarm \
  --alarm-name "ASG-ScaleIn-LowCPU" \
  --alarm-description "Scale in when CPU drops below 30% across ASG" \
  --metric-name CPUUtilization \
  --namespace AWS/EC2 \
  --statistic Average \
  --period 300 \
  --threshold 30 \
  --comparison-operator LessThanThreshold \
  --dimensions Name=AutoScalingGroupName,Value=my-app-asg \
  --evaluation-periods 3 \
  --alarm-actions arn:aws:autoscaling:us-east-1:123456789012:scalingPolicy:...:policyName/scale-in-policy
Notice the scale-in alarm uses 3 evaluation periods (15 minutes) versus 2 for scale-out. You want to be confident that the load has genuinely dropped before terminating instances. Scale out fast, scale in slow.
Step 5 – Create a CloudWatch Dashboard
Dashboards give your team a real-time visual overview of infrastructure health. They are the first thing you open during an incident.
Via AWS Console: Go to CloudWatch → Dashboards → Create Dashboard → Name it AppMonitoring → Add a Line widget → Select AWS/EC2 → CPUUtilization → Choose your instance → Create Widget → Save Dashboard.
Via CLI:
aws cloudwatch put-dashboard \
  --dashboard-name "AppInfrastructureMonitoring" \
  --dashboard-body '{"widgets":[{"type":"metric","properties":{"metrics":[["AWS/EC2","CPUUtilization","InstanceId","i-0abcd1234efgh5678"]],"title":"EC2 CPU Utilization","stat":"Average"}}]}'
Pin your most critical alarm statuses to the dashboard. During incidents, this becomes your war room screen showing exactly what is broken and what is healthy.
Step 6 – Install CloudWatch Agent for Memory and Disk Metrics
Default EC2 metrics do not include memory or disk usage. AWS cannot see inside your operating system. The CloudWatch Agent solves this by running on your instance and pushing custom metrics.
Install the agent:
# Amazon Linux
sudo yum install amazon-cloudwatch-agent -y

# Ubuntu
sudo apt install amazon-cloudwatch-agent -y
Basic config file at /opt/aws/amazon-cloudwatch-agent/bin/config.json:
{
  "metrics": {
    "append_dimensions": {
      "InstanceId": "${aws:InstanceId}"
    },
    "metrics_collected": {
      "mem": {
        "measurement": ["mem_used_percent"],
        "metrics_collection_interval": 60
      },
      "disk": {
        "measurement": ["disk_used_percent"],
        "metrics_collection_interval": 60,
        "resources": ["/"]
      }
    }
  }
}
Start the agent:
sudo /opt/aws/amazon-cloudwatch-agent/bin/amazon-cloudwatch-agent-ctl \
  -a fetch-config -m ec2 \
  -c file:/opt/aws/amazon-cloudwatch-agent/bin/config.json -s
After the agent starts, memory and disk metrics appear in CloudWatch under the CWAgent namespace. You can now create alarms on memory usage exactly like we did for CPU.
Understanding Alarm States
Every CloudWatch Alarm is always in one of three states.
OK means the metric is within the defined threshold and everything is healthy.
ALARM means the metric has breached the threshold for the required number of evaluation periods and action is being taken.
INSUFFICIENT_DATA means there is not enough data yet to evaluate the alarm. This is usually seen right after creation or after an instance stops sending metrics.
Always configure both alarm-actions and ok-actions on your SNS topic. This way you get notified when a problem starts AND when it resolves — closing the loop on every incident.
AWS CloudWatch Monitoring Setup Best Practices
Always use at least 2 evaluation periods before triggering alarms to avoid noisy false alerts from brief CPU spikes.
Set treat-missing-data to breaching for availability-critical instances because missing metrics usually means the instance is down.
Use composite alarms for complex scenarios — for example, only alert when both CPU and memory are high simultaneously.
Tag all CloudWatch alarms with environment, team, and service so they are easy to filter and manage in large accounts.
Create separate SNS topics for different severity levels: critical, warning, and informational. Route critical alerts to PagerDuty or OpsGenie for on-call escalation.
Review and tune your alarm thresholds monthly. What works at launch may not work at scale six months later.
Combine CloudWatch with AWS X-Ray for distributed tracing and CloudTrail for audit logs to build a complete observability picture.
Cost Breakdown
The first 10 custom metrics and 10 alarms are free under the AWS Free Tier. After that, alarms cost around $0.10 per alarm per month. Detailed monitoring adds approximately $0.014 per instance per month. The CloudWatch Agent for custom metrics charges per metric per month. For most small to medium applications, a complete monitoring setup stays well under $15 per month total.
Check current pricing at https://aws.amazon.com/cloudwatch/pricing
Conclusion
Setting up CloudWatch monitoring is one of the highest-ROI investments you can make in your AWS infrastructure. The combination of CPU alarms, Auto Scaling triggers, SNS notifications, and custom agent metrics gives you complete visibility into your application health around the clock — without manual checking.
Here is what we built in this blog: detailed EC2 monitoring for 1-minute granularity, an SNS topic for real-time alert delivery, a CPU alarm that fires when utilization exceeds 70%, Auto Scaling alarms that automatically add and remove instances based on load, a CloudWatch Dashboard for visual monitoring, and the CloudWatch Agent to capture memory and disk metrics.
The key takeaway is simple — don’t wait for an outage to set up monitoring. Build it before you need it. Your future self, your team, and your users will thank you.
Written by Deekshitha R
LinkedIn: www.linkedin.com/in/deekshitha-raveendran-31581527b